NC School Board Candidate Finds Examples Of CRT In Rejected Florida Books

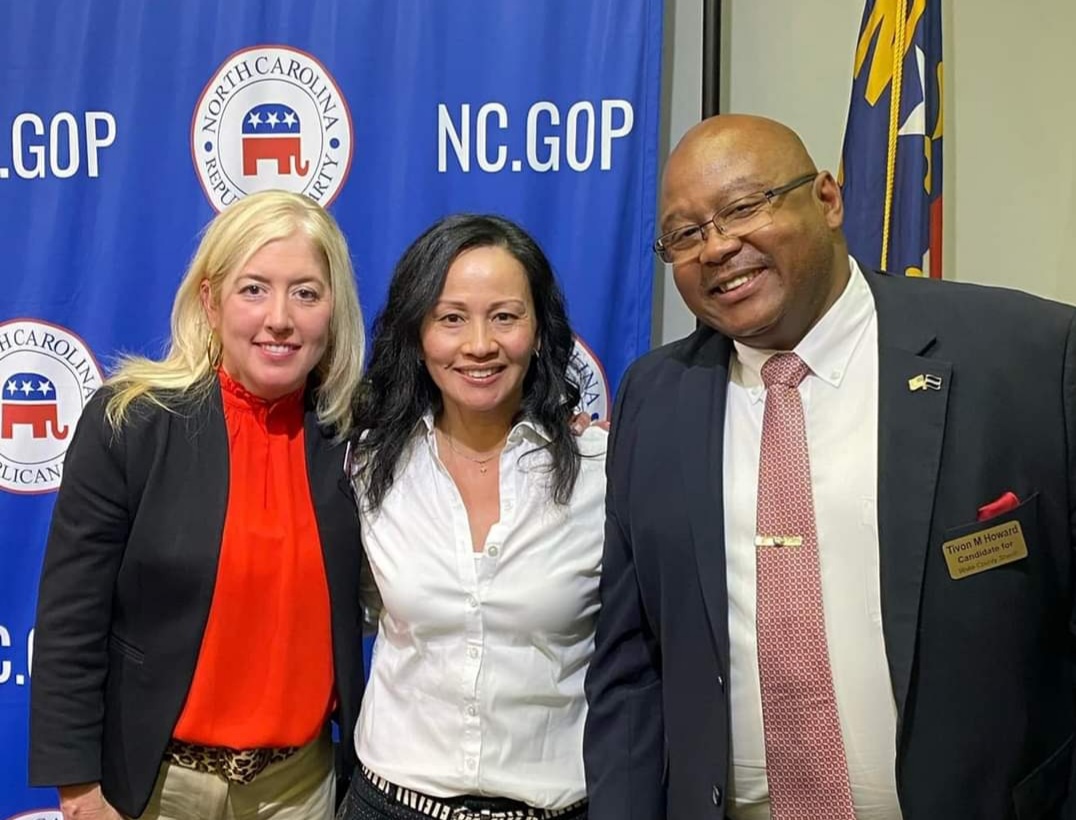
North Carolina School Board Candidate for Wake County, Katie Long, has been busy researching the topic of Florida’s rejected Math Books, because it is a topic of grave concern to her, and to the parents and community members she is running to represent.

“I knew the people in my district would want to have this information, so I contacted people in Florida on the School Board. I knew they would have the information about those books, and I asked them for as much information as I could get- because I hope someday in North Carolina we will have the opportunity to be where Florida is now. They responded to me pretty quickly so I posted the information for the public,” Long told me. “I want everyone to be ready and have accurate information when our time comes.”

Long posted on her social media immediately the list of books that the Florida Board of Education published of rejected books.  And she asked for details about what in the books made them rejected under Common Core or Critical Race theory- what made them problematic.

READ PRESS RELEASE ABOUT THE REJECTED BOOKS

Her Facebook Post:

Long also requested examples of the inappropriate content that caused the books to be rejected. Here are the emails she got back:

REJECTED BOOKS:

From: “Byrd, Esther” <Esther.Byrd@fldoe.org>
Date: April 18, 2022 at 9:21:37 PM EDT
To: Katie Long <katie_XXXXX@yahoo.com>
Subject: Re: Request for list of rejected 54 math books

Ms. Long,

Thank you for your interest in the rejected Instructional Materials. The information you requested can be found at the link below under the title “2021-2022 Mathematics Instructional Materials Not Recommended List (PDF)”.

https://www.fldoe.org/academics/standards/instructional-materials/

Best,
Esther Byrd

CONTENT:

From: DOEPressOffice <DOEPressOffice@fldoe.org>
Date: April 21, 2022 at 2:57:55 PM EDT
Subject: Mathematics Instructional Materials Examples

Good afternoon,

Thank you for contacting us requesting examples from the mathematics instructional materials that were not included in the adoption list.

As a reminder, publishers have the ability to appeal any non-adoption decision. Publishers also have the ability to substitute or revise their submitted bids to be included on the state’s adopted list if the substitution or revision of submitted instructional materials ultimately meets Florida’s bid specifications.

We are committed to working with publishers to remediate all deficiencies identified during the review to ensure the broadest selection of high quality instructional materials are available to school districts and Florida’s students.

At this time, those who have submitted textbooks for consideration still own the material (i.e. their content is copyrighted and we are unable to release it to the public at this time, pending review). Having said that, we have posted a few examples on our website that we received from the public.

As has been recently indicated at various events around the state, if and when we can share such materials, we will work to do so.

Thanks,

Cassie Palelis

Press Secretary

Florida Department of Education

325 West Gaines Street, Room 1524

Tallahassee, FL 32399-0400

PL: 850-245-0413

HERE IS THE PROBLEM ACCORDING TO THEIR WEBSITE:

DISCLAIMER: Based on the volume of requests the Department has received for examples of problematic elements of the recently reviewed instructional materials, the following are examples provided to the department by the public and presented no conflict in sharing them.  These examples do not represent an exhaustive list of input received by the Department.  The Department is continuing to give publishers the opportunity to remediate all deficiencies identified during the review to ensure the broadest selection of high quality instructional materials are available to the school districts and Florida’s students.

Application Exercises 103. The bar graph shows the differences among age groups on the Implicit Association Test that measures levels of racial prejudice. Higher scores indicate stronger bias. Bar graph titled, Measuring Racial Prejudice, by Age The score on the Implicit Association Test is shown on the y-axis. It goes from 0 to 46. The Key states a score of less than 15 shows little to no bias. A score of 15 to 35 shows slight bias. A score of 35 to 65 shows moderate bias. The y-axis is broken down into seven groups based on age. Group 1 are all ages below 18. Group 2 represents ages 18 to 24. Group 3 represents ages 25 to 34. Group 4 represents ages 35 to 44. Group 5 represents ages 45 to 54. Group 6 represents ages 55 to 64. Group 7 represents ages 65 and older. Group 1 received a score of 33. Group 2 received a score of 35. Group 3 received a score of 32. Group 4 received a score of 29. Group 5 received a score of 31. Group 6 received a score of 34. Group 7 received a score of 42. Source: The Race Implicit Association Test on the Project Implicit Demonstration Website a. The data can be described by following the polynomial model of degree 3: S = 0.2x3 – 1.5x2 + 3.4x + 25 + (0.1x3 – 1.3x2 + 3.3x + 5). In this polynomial model, S represents the score on the Implicit Association Test for age group x. Simplify the model. b. Use the simplified form of the model from part (a) to find the score on the Implicit Association Test for the group in the 45-54 age range. How well does the model describe the score displayed by the bar graph? c. Shown in a rectangular coordinate system is the graph of the polynomial model of degree 3 that describes scores on the Implicit Association Test by age group. Identify your solution from part (b) as a point on the graph. 104. The bar graph at the top of the next column shows the differences among political identification groups on the Implicit Association Test that measures levels of racial prejudice. Higher scores indicate stronger bias. Bar graph titled, Measuring Racial Prejudice, by Political Identification The score on the Implicit Association Test is shown on the y-axis. It goes from 0 to 46. The Key states a score of less than 15 shows little to no bias. A score of 15 to 35 shows slight bias. A score of 35 to 65 shows moderate bias. The y-axis is broken down into seven groups based on Political Identification. Group 1 shows Very Liberal. Group 2 shows Moderately Liberal. Group 3 shows Slightly Liberal. Group 4 shows Neutral. Group 5 shows Slightly Conservative. Group 6 shows Moderately Conservative. Group 7 shows Very Conservative. Group 1 received a score of 26. Group 2 received a score of 31. Group 3 received a score of 34. Group 4 received a score of 31. Group 5 received a score of 37. Group 6 received a score of 42. Group 7 received a score of 39. Source: The Race Implicit Association Test on the Project Implicit Demonstration Website a. The data can be described by following the polynomial model of degree 3: S = -0.02x3 + 0.4x2 + 1.2x + 22 + (-0.01x3 – 0.2x2 + 1.1x + 2). In this polynomial model, S represents the score on the Implicit Association Test for political identification x. Simplify the model. b. Use the simplified form of the model from part (a) to find the score on the Implicit Association Test for the slightly conservative political identification group. Does the model underestimate or overestimate the score displayed by the bar graph? By how much? c. Shown in a rectangular coordinate system is the graph of the polynomial model of degree 3 that describes scores on the Implicit Association Test, by political identification. Identify your solution from part (b) as a point on the graph.

Adding and Subtracting Polynomials What? Me? Racist? More than 2 million people have tested their racial prejudice using an online version of the Implicit Association Test. Most groups’ average scores fall between “slight” and “moderate” bias, but the differences among groups, by age and by political identification, are intriguing. In this section’s Exercise Set (Exercises 103 and 104), you will be working with models that measure bias: S = 0.3x3 – 2.8x2 + 6.7x + 30 S = -0.03x3 + 0.2x2 + 2.3x + 24 In each model, S represents the score on the Implicit Association Test. (Higher scores indicate stronger bias.) IN the first model (see Exercise 103), x represents age group. In the second model (see Exercise 104), x represents political identification.

Lesson Objectives Content Objective Students identify numbers from 1 to 5 in sequence understanding that each successive number name is one larger. Language Objectives Students identify the next successive number to five when counting by stating the number. To cultivate conversation and optimize output, ELs will participate in MLR8: Discussion Supports. SEL Objective Students build proficiency with social awareness as they practice with empathizing with classmates.

Social and Emotional Learning Building Student Agency This unit introduces students to the Math is…Mindset feature of the program. This feature is designed to build student agency by focusing on students’ social and emotional learning, specifically the five competencies that make up the framework established by the Collaborative for Academic, Social, and Emotional Learning (CASEL).

DISCLAIMER: Based on the volume of requests the Department has received for examples of problematic elements of the recently reviewed instructional materials, the following are examples provided to the department by the public and presented no conflict in sharing them.  These examples do not represent an exhaustive list of input received by the Department.  The Department is continuing to give publishers the opportunity to remediate all deficiencies identified during the review to ensure the broadest selection of high quality instructional materials are available to the school districts and Florida’s students.

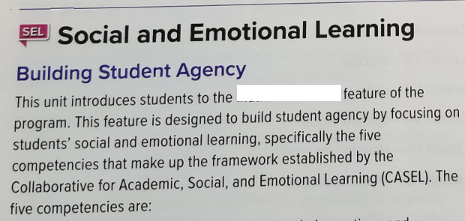
Long Is running on a platform of transparency on the issues she knows other parents want to know about, such as Critical Race Theory, Common Core, Social-Emotional Learning, and funding.

Long is a member of a close-knit group of parent activists who have been working on school issues daily for almost two years, and paramount to her campaign for school board, she wants to evaluate where the money in Wake County has gone to fund schools- she spoke about it recently from the latest School board meeting:

For Further reading on Katie Long for Wake County School Board:

On Florida’s Leading Legislation Against Common Core:


And what Wake County Parents are up against:

Ben Bergquam's Updates

Sign up today to get updates from Ben from Frontline America and Real America's Voice. Ben writes every email personally. Don't miss out!


This will close in 0 seconds